
Social Progress Index By Component
The following dashboard shows a heat map of the different components of the Social Progress Index by census tract grouped by city. This is a quick way to sort by highest/lowest ranking scores or view high and low scores across multiple census tracts using the heat map. Click on your census tract to view your neighborhood against city scores.
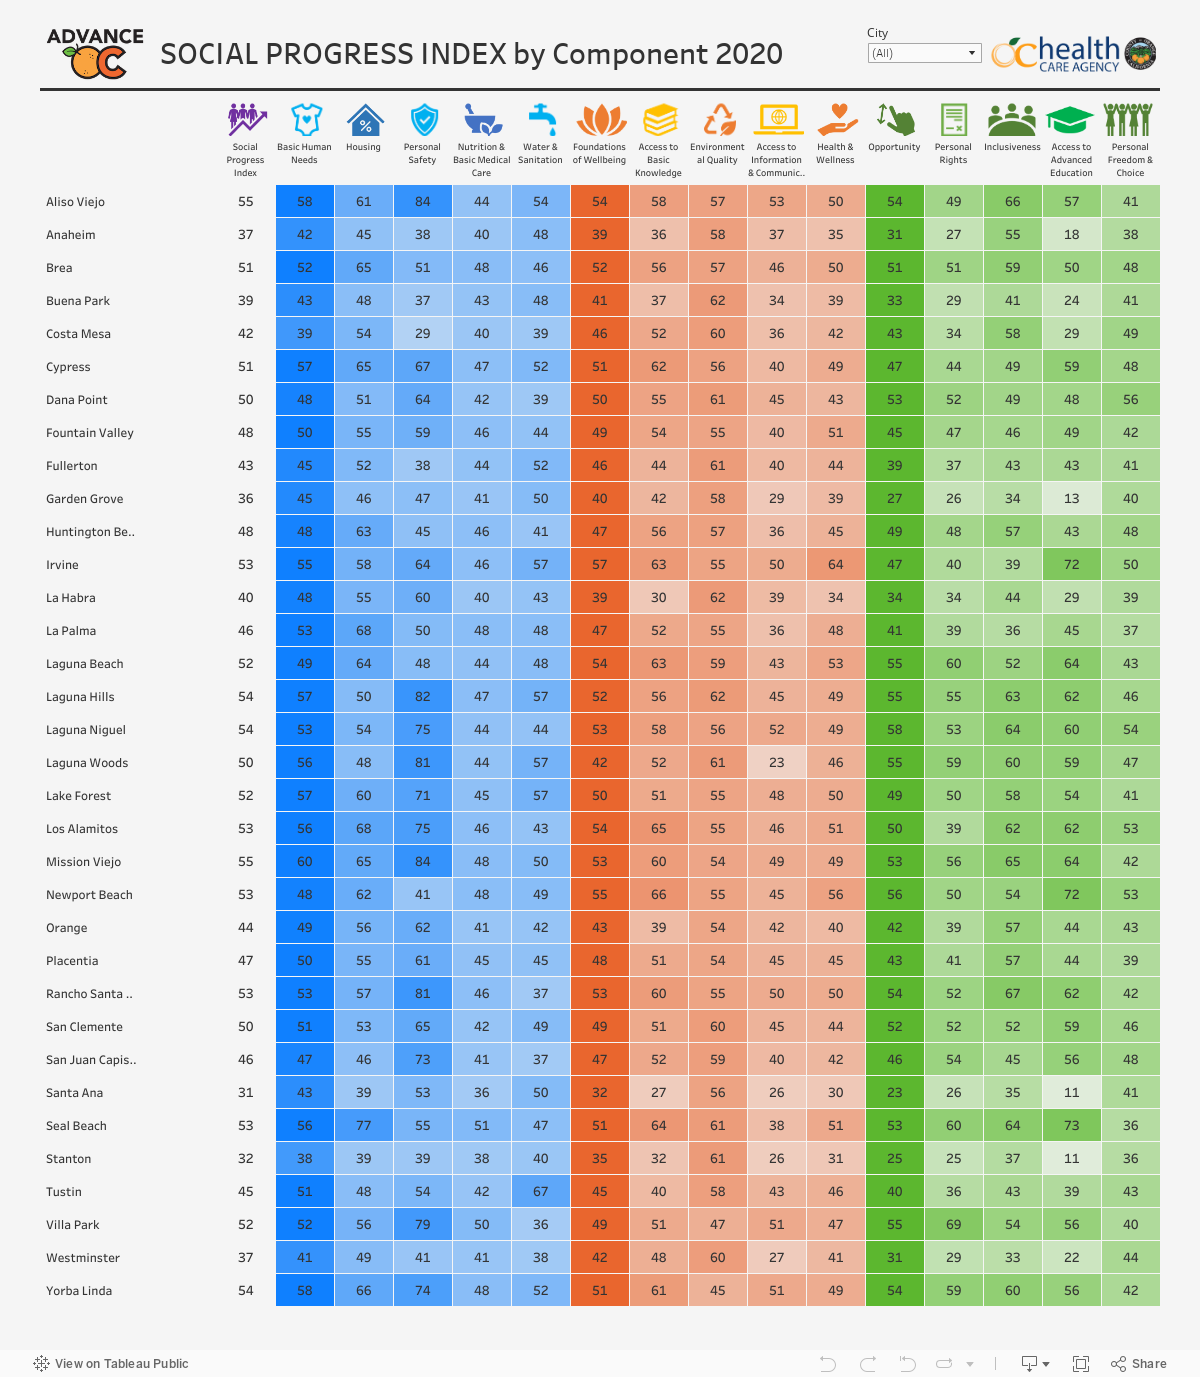
The interactive graph is best viewed on larger devices.